ThreatStream ThreatRadar Dashboard
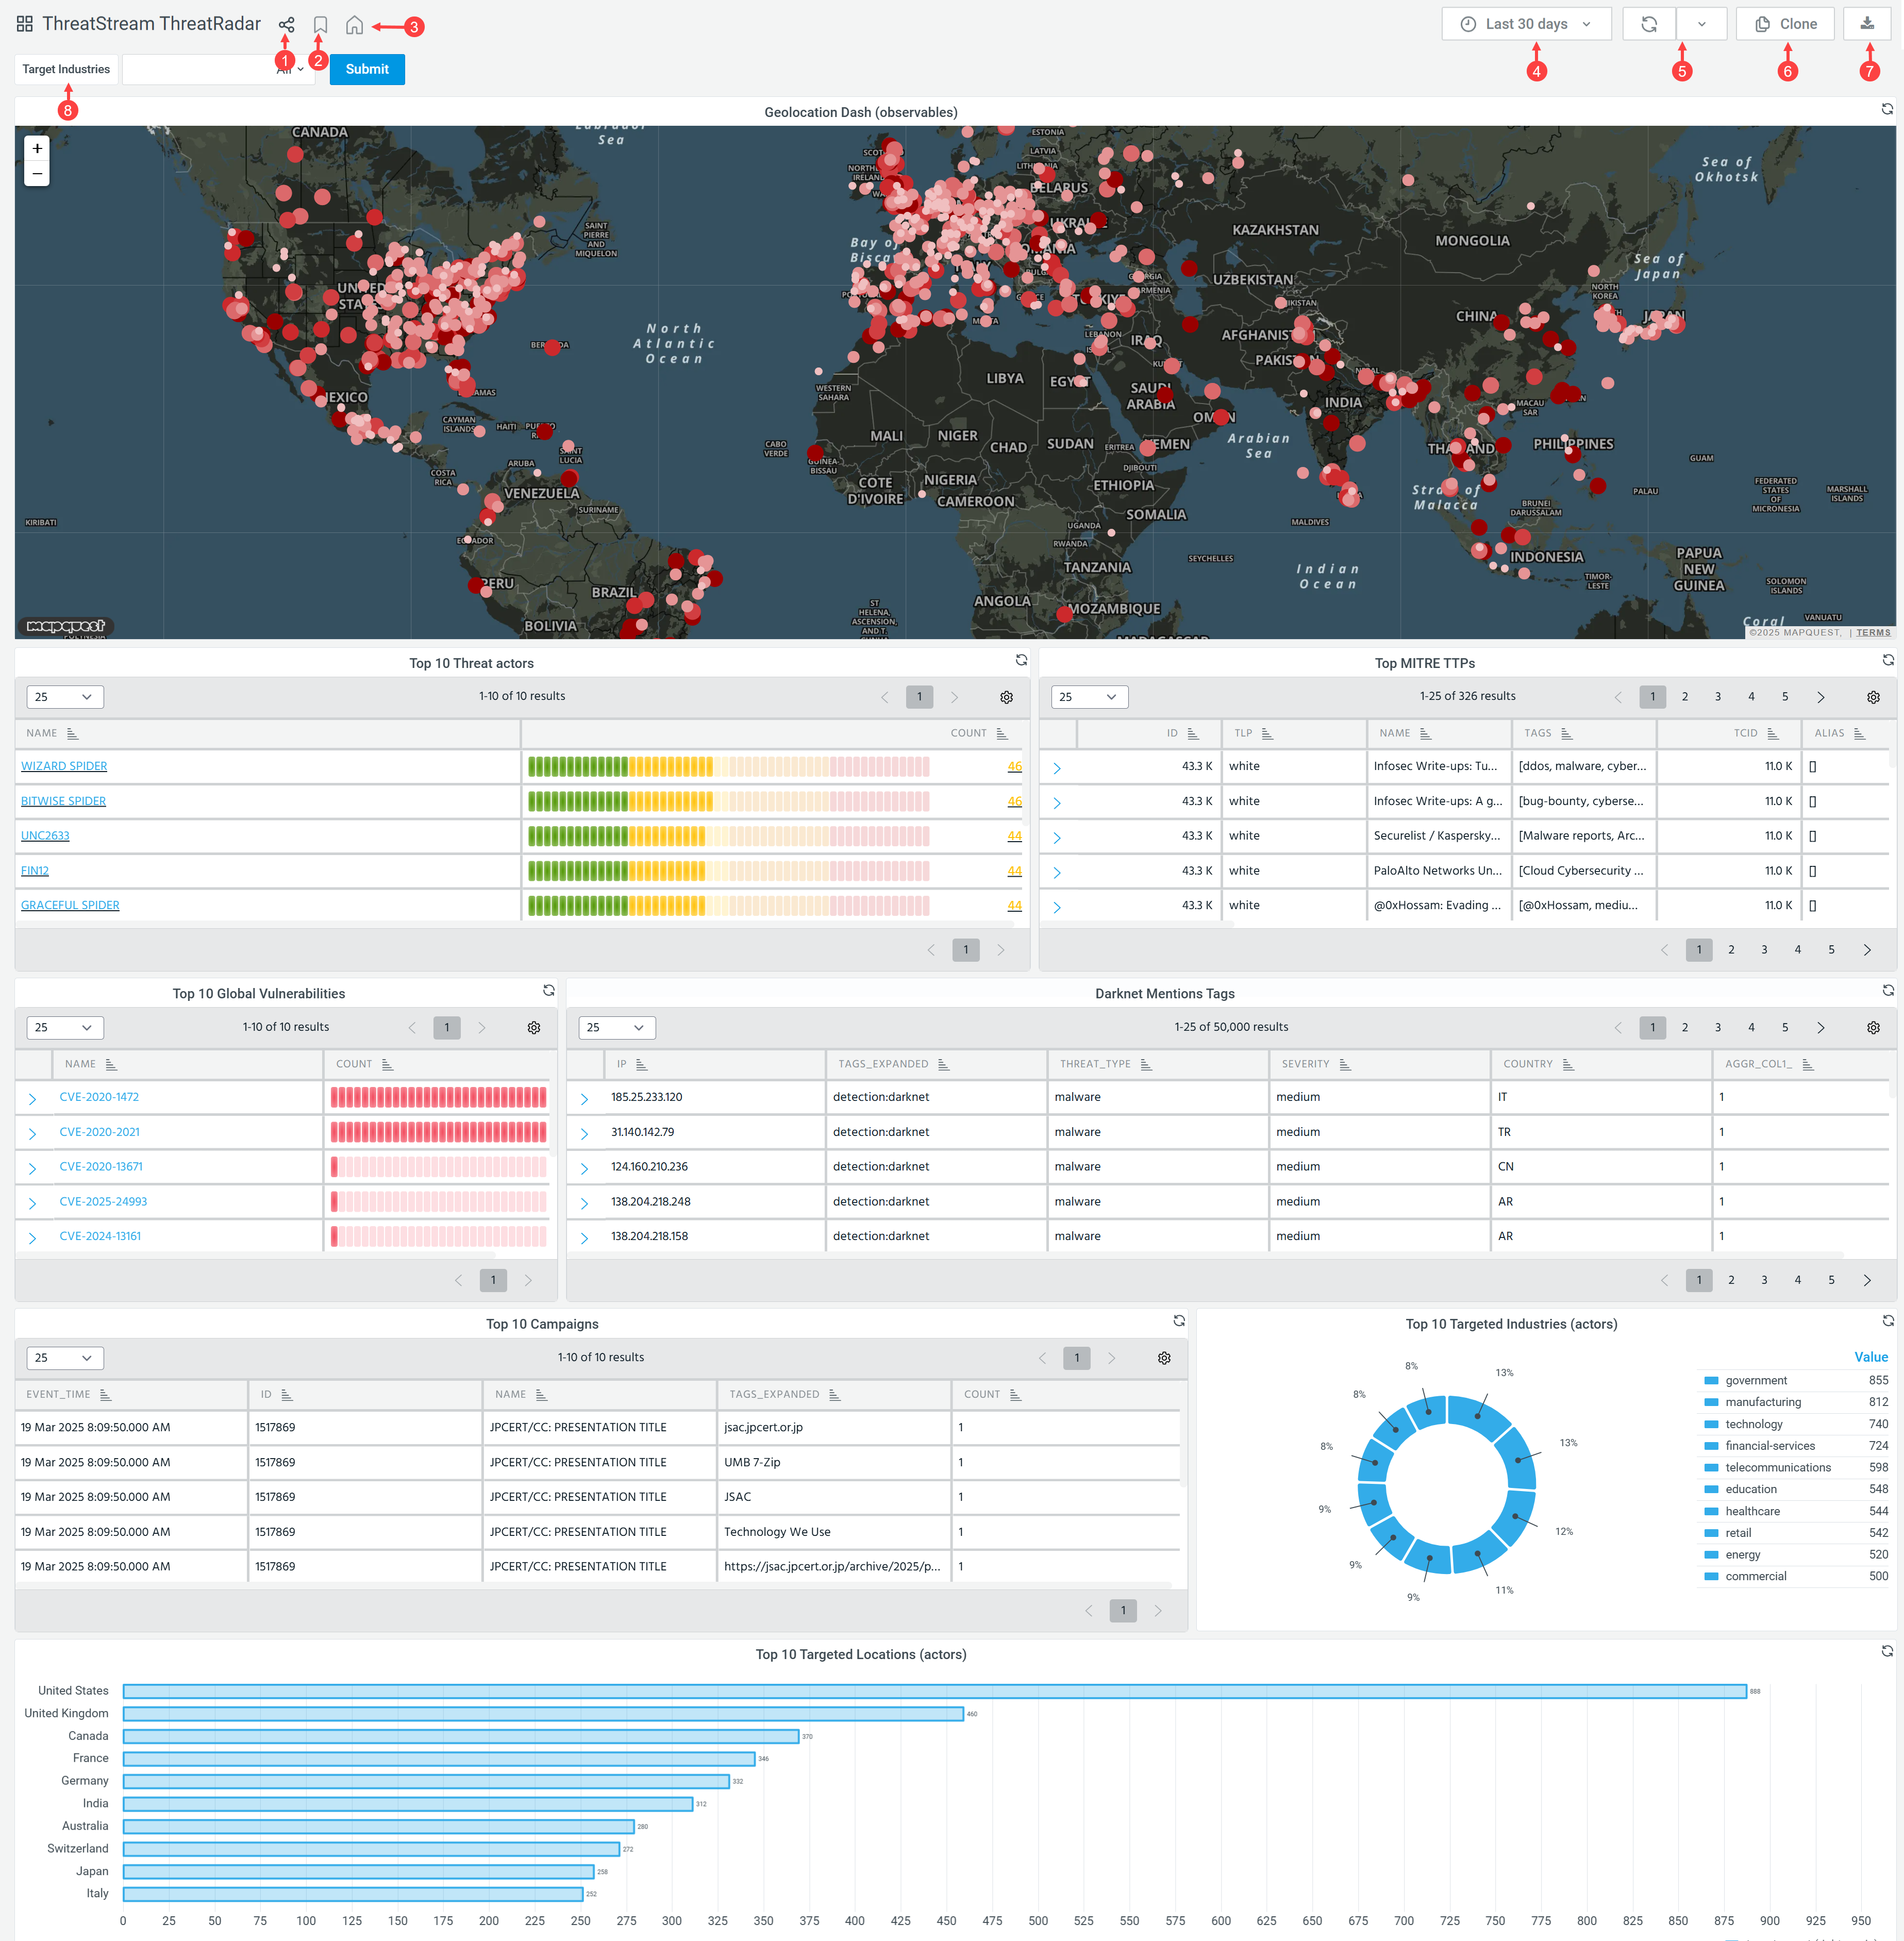
The ThreatStream ThreatRadar is an out-of-the-box, Anomali-curated dashboard that provides real-time visibility into global threats. It delivers actionable threat intelligence, enabling organizations to proactively defend against industry-specific attacks, minimize business disruptions, and enhance their security posture.
Powered by Anomali Query Language (AQL), the dashboard utilizes the observables and threat_models lookup tables, which leverage ThreatStream data and refresh every 24 hours.
For details, about these lookup tables, refer to observables and threat_models.
To access the ThreatStream ThreatRadar dashboard, navigate to Dashboard > Library and locate the ThreatStream ThreatRadar dashboard using the Search field.
To access the ThreatStream ThreatRadar dashboard in the classic UI:
-
Navigate to Dashboard > Library.
-
Click the ThreatStream Dashboards folder.
-
Click ThreatStream ThreatRadar.
(Click the image to enlarge it)

|
Share the dashboard by copying the dashboard URL or exporting it in JSON format. For details, see Sharing Dashboards or Sharing Dashboards (Classic UI) if you use the classic UI. |

|
Add the dashboard to the list of favorites. All your favorite dashboards can be found in the Bookmarked section of the Dashboard menu. |

|
Designate the current dashboard as your primary dashboard. The setting is saved per user, so each user in the organization can designate their own primary dashboard. The name of the primary dashboard appears as the first item in the Dashboard menu. |

|
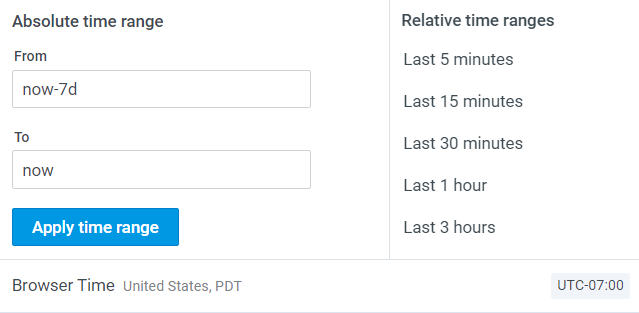
Select a time range for the data displayed on the dashboard. You can select an absolute time range or a relative time range. By default, data for the last 7 days is displayed.
|

|
Select a time range for refreshing the dashboard. Select Off if you don’t want to refresh the dashboard. Click |

|
Clone the dashboard. For details, see Cloning Dashboards or Cloning Dashboards (Classic UI) if you use the classic UI. |

|
Export the dashboard in PDF format. For details, see Exporting Dashboards in PDF Format or Exporting Dashboards in PDF Format if you use the classic UI. |

|
Select a target industry and click Submit. |
 to force dashboard refresh.
 ThreatStream ThreatRadar Dashboard Panels
The following table contains the list of all panels available on the ThreatStream ThreatRadar dashboard. To view only data relevant to the target industry of your interest, use the Target Industry drop-down list.
| Panel | Description |
|---|---|
| Geolocation Heatmap | The geomap displays source locations of observables. |
| Top 10 Actors by Industry | The table displays top 10 threat actors by industry. The Target Industries drop-down menu allows you to return threat actors for a specific industry. The LCD gauges in the table represent the following thresholds: green (0-25), yellow (26-50), orange (50-75), and red (75 and above). |
| Top 10 MITRE TTPs | The table displays the top 10 attack patterns from all feeds. Attack patterns includes MITRE TTPs plus all other TTPs. |
| Top 10 Vulnerabilities | The table displays the top 10 CVEs (Common Vulnerabilities and Exposures) that have been reported by all feed sources. |
| Top 10 Campaigns | The table displays top 10 campaigns. |
| Darknet Mentions Tags |
The table displays darknet mentions in tags by IP. The darknet is a part of the Internet that includes all hidden online networks and services, which can only be accessed via special client software and cannot be found using ordinary search engines. |
| Top 10 Targeted Industries | The pie chart displays the number of actors targeting each industry. The list on the left side displays the number of actors associated with each industry, where as the pie chart displays the percentage. |
| Top 10 Targeted Locations | The bar chart displays top 10 locations targeted by threat actors by the number of occurrences in all feeds. |
All ThreatStream ThreatRadar dashboard panels have the management menu allowing you to take the following actions:
-
Open a panel query in Event Search
-
View a full-screen version of a panel
-
Share a panel with other ThreatStream users in your organization.
-
Inspect panel data
-
Refresh panel data
For details, refer to Managing Dashboard Panels or Managing Dashboard Panels (Classic UI) if you use the Classic UI.